Back to Basics: Learning Python from Scratch

I’ve been working a lot with the R programming language recently and decided to take some time this weekend to refocus on my original goal of mastering Python. My plan all along has been to work in both languages, but my classes have put the emphasis on R. I decided to keep this weekend incredibly simple and just focus on the foundational components of the language that might be different from R; things like lists, if/else statements, for loops, things like that. It’s been a lot of fun, and I’ve enjoyed myself. Working in Jupyter Notebooks makes this process so incredibly easy because all I need to do is work in that IDE and execute the code right on the screen. RStudio is similar, but it’s more of a process, and it’s missing the overall “flow” that I think has attracted me to learning languages in the first place.
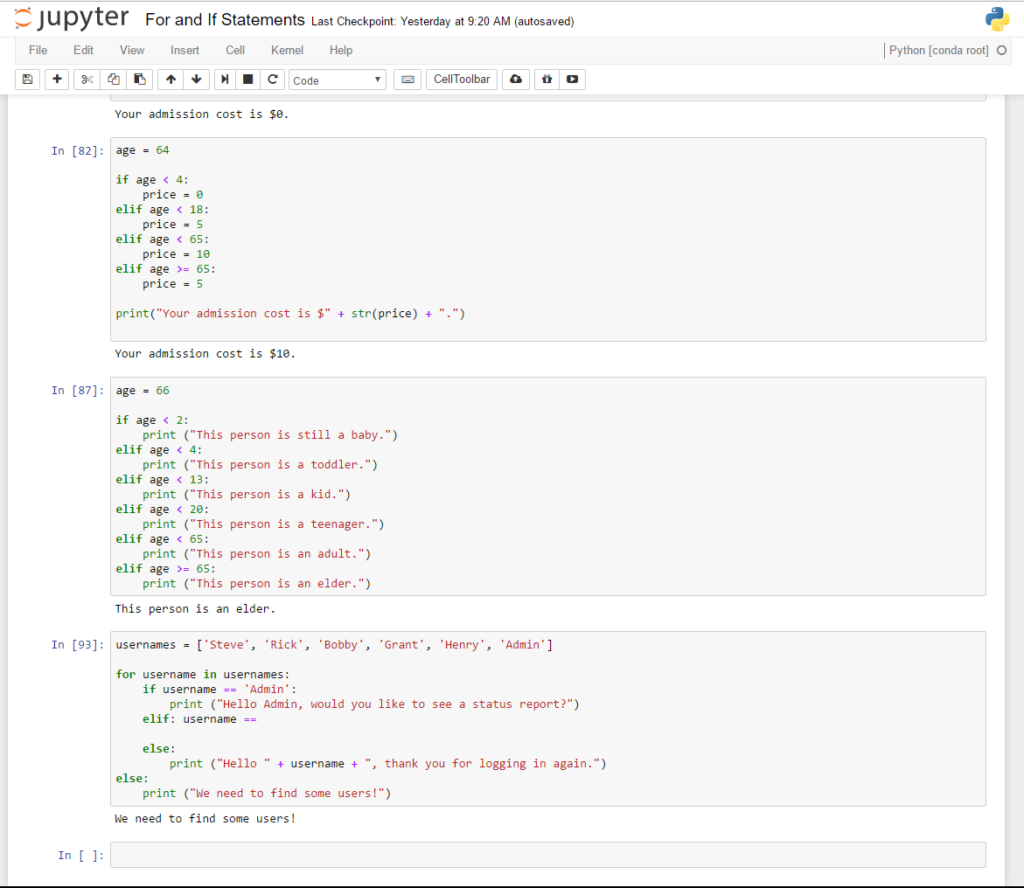
My Extremely Basic Code

The primary resource I’ve been using this weekend has been a book called ‘Python Crash Course: A Hands-On, Project-Based Introduction to Programming‘ by Eric Matthes. Eric has done a great job of writing this book, keeping it simple, and building in instances where the reader can test the concepts and create some code themselves. As a beginner, I appreciate the challenge and opportunity to be creative and make something unique. I find that this opportunity to test your knowledge is missing in a lot of online learning environments, like Udemy. No disrespect to Udemy at all, it’s just a constraint of the online learning environment that is challenging to work around. Anyways, I chose this book because it promised projects working with data science, had high ratings on Amazon (for a good reason), and I needed something with a project-based approach where I could make mistakes, fail, and overcome the challenges when I actually experiment and apply the concepts.
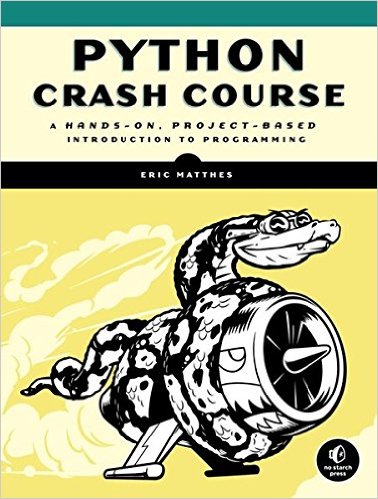
Python Crash Course
Python Crash Course

Classification Trees Using R

Recently in class, we’ve been building models called classification trees (also known as decision trees). There are a few different types of models used in decision tree learning, but classification trees allow for predictions of outcomes that are various classifications. The classic example is the iris dataset published in 1936 by Ronald Fisher. In this example, we can see how the outcome (species name) can be accurately predicted using a classification tree to create decision branches. See below:

Classification Tree of Iris Data

Classification trees have widespread applications across a variety of fields, but one of the more powerful examples are the implications it can have in health and medicine, where predictive modeling can be applied to large sets of data to hopefully help spot diseases and illnesses before they occur. We experimented with how these models could be built in our class, using anonymized data where the patient had a growth that was classified as either malignant or benign. Using these classification trees, a researcher (or software) can apply this trained algorithm or script to new data where the outcome is unknown and develop a plan to intervene with those patients (provide free screenings, contact patients that the algorithm predicts may be at risk, and so on). While these techniques shouldn’t replace regular visits and interactions with medical professionals, they can help an industry under enormous constraints be proactive in detecting and treating diseases before they cost the patient time, money, or even their lives.

Classification Tree for Breast Cancer Research

Cluster Analysis with R

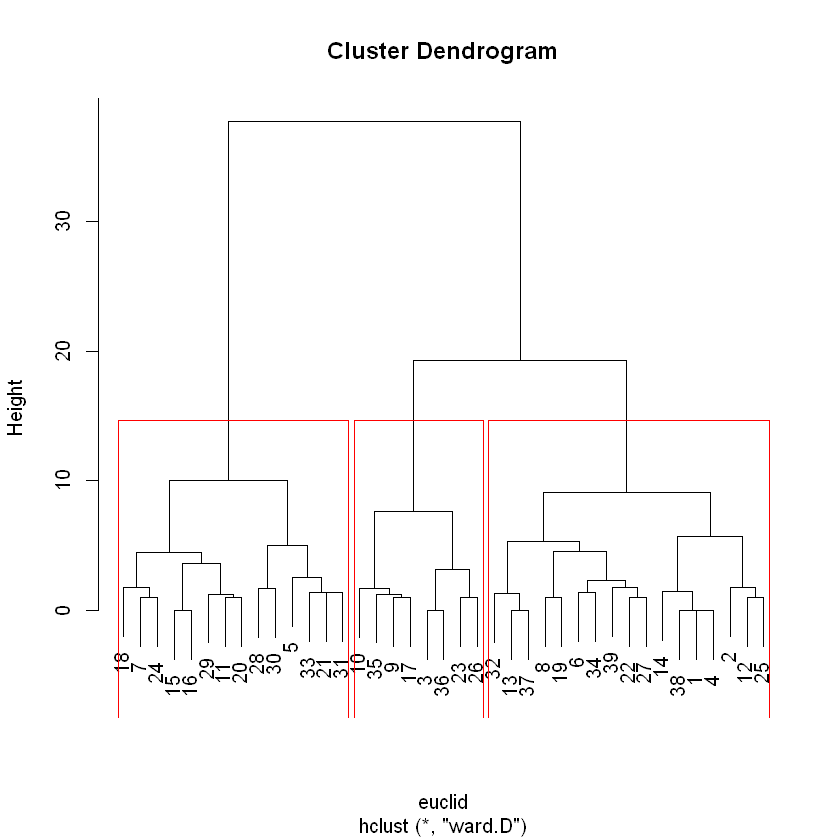
Recently in one of my classes, we’ve been experimenting with using R for running cluster analysis. Clustering is a way of assigning rows or records (or respondents, in the end) into groups. The person running the analysis is in control of how many groups they want to create, but depending on the data and number of rows, you’ll usually be setting up no more than 10 groups. At any rate, this is an extremely powerful tool because it allows the people in your organization to determine what your customers have in common, which allows for segmentation and a tailored approach to working with your customers. This isn’t just a greedy way of finding how to squeeze more money out of people, it can be used to create different products, user experiences, subscription packages, or any other offering that ultimately makes the relationship you have with your customer just a little bit better.

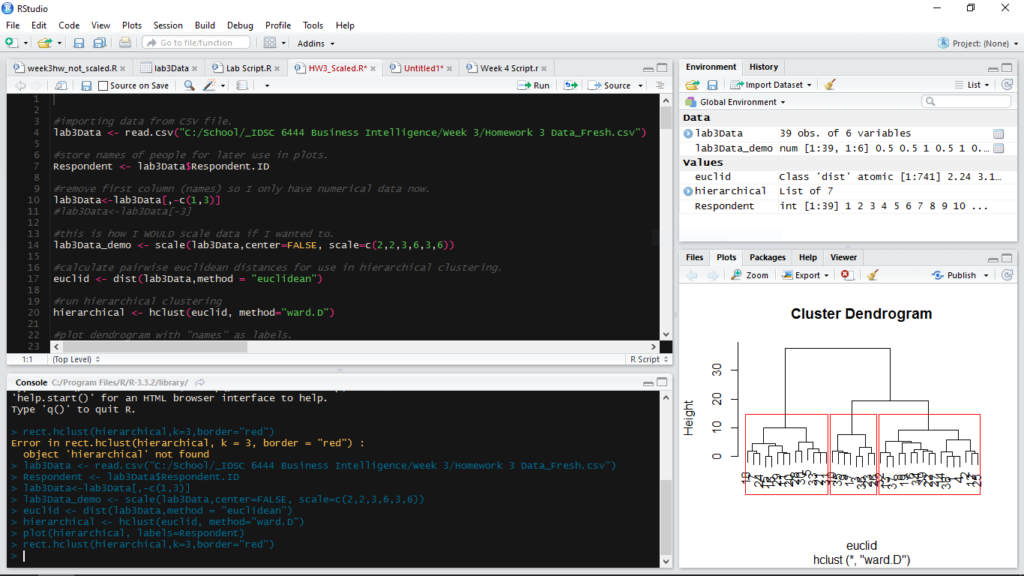
I’ve been learning a bit of R lately, as my class requires us to use it, and I can tell that it’s not only extremely powerful but has a lot of depth. I haven’t even scratched the surface. I’ve been using an IDE called RStudio. RStudio allows you to view the command line (if you use R out of the box, all it will do is open a command prompt window), create your script (the script I’m using is modified from one we used in class, I’m not that good yet :)), view all of the variables you’ve assigned and all of the data you’re using, and finally a window where you can view your plots or any outputs you’ve asked R to create. It’s quite fancy.

RStudio
RStudio

The data we used was fake demographic data that a fake automobile company had collected. Our assignment was to divide the respondents into as many clusters as we thought was appropriate (I chose 3, but you could certainly make a case for 4), and then provide recommendations to the fake marketing manager on how this information could be used to better market to our customers.

Cluster analysis is a lot of fun and should definitely be a tool in every marketer’s toolbox. That being said, it is completely subjective and you could make a case for as many or as few clusters of customers as you’d like. Also, it’s important to remember that even though it’s convenient for you to assign individuals to groups, you’ll still need to deal with people on an individual level and train your staff to not segment people or make assumptions just because someone fits your model. This all reminds me of an article we read for our class about this mathematics Ph.D. that applied clustering to his dating life. Sometimes, you can overthink things.

As always, if you want to view (and make changes or recommendations) my script or the raw data, you can do that at GitHub.